
Description: This tutorial is an introduction to FIWARE Wirecloud - a generic enabler visualization tool which allows end users without programming skills to create web applications and dashboards to visualize their NGSI data. The tutorial explains how to create a Wirecloud workspace and upload widget to visualise the data. Once the widgets are configured the data is displayed on screen
The tutorial demonstrates examples of interactions using the Wirecloud GUI only. No programming is involved within the tutorial itself, as Wirecloud is designed to be usable by all type of user, even those with limited programming skills. However the commentary continues to reference various programming principles and standard concepts common to all FIWARE architectures.
Additional materials covering how to develop and create your own widgets will be the subject of a later tutorial.
Visualizing NGSI Data using a Mashup
"One picture is worth a thousand words."
— Fred R. Barnard (Printers' Ink)
As a Smart Solution evolves, it is necessary to be able to analyse and understand the current system context, so that appropriate decisions can be made. An obvious first step of data analysis is to display context data on screen. At this stage it is not necessarily known which context data is relevant and how it would be best displayed to the end user. Flexible rapid prototyping is required to be able to refine, enhance and manipulate the data, display and tweak the visualizations, and add further information as necessary.
An application mashup is a web application which uses content from multiple sources to display a single new service with a graphical interface. Most mashups are visual and interactive by design, and many are short-lived representations which are only required to help analyse a single problem.
The FIWARE Wirecloud Generic Enabler is a tool which helps users to rapidly generate new application mashups based on NGSI and other data sources. To speed up development, the Wirecloud architecture has been defined to split mashup operations into a series of simple reusable tasks (widgets and operators). Each task has well-defined input and output interfaces, and the Wirecloud UI allows mashup creators to wire up a series of tasks into a complex chain of data processing and visualization events.
Broadly speaking application mashup tasks can be split into four categories:
- Data sources: These are operators that provide information for consumption elsewhere. For example, an operator that retrieves some type of information from an NGSI web service.
- Data targets: The reverse of the above. These operators push information out to an external microservice
- Data transformers: This type of operator manipulates data in order to make it usable by other tasks further down the chain within the Wirecloud ecosystem. For example, transposing form list values or renaming attributes to align with an input interface downstream
- Visual Components: Combinations of HTML and JavaScript which display data on a browser online. Within Wirecloud, visual components are known as widgets.
The overall aim of Wirecloud is to allow someone without a programming background to be able to create data visualizations using a drag-and-drop interface. A wide range of existing open-source Wirecloud Widgets and Operators are already available and can be used to create complex visualizations.
The existing widget and operator set covers a wide range of scenarios, but can be complemented by your own additional widgets. A background in JavaScript and HTML is necessary in this case. Creating your own widgets will be the subject of a subsequent tutorial.
Once a mashup has been wired up and created it can be also be shared wholesale with end users. \
Architecture
This application adds the Wirecloud application mashup into the existing Stock Management and Sensors-based application created in previous tutorials. The aim of the tutorial is to be able to monitor devices and wire-up a simple supermarket finder. This monitoring tool mashup will be able to duplicate and replace much of the visualisation functionality already found in the tutorial application itself (which is written in PUG, Node.JS and JavaScript). The aim is to create an equivalent application without resorting to writing a line of code.
The Users in Wirecloud have been created using the standard identity management component, Keyrock. Overall the system makes make use of four FIWARE components - the Orion Context Broker,the IoT Agent for UltraLight 2.0, the Keyrock Identity Manager and the newly integrated Wirecloud application mashup tool. Usage of the Orion Context Broker is sufficient for an application to qualify as “Powered by FIWARE”.
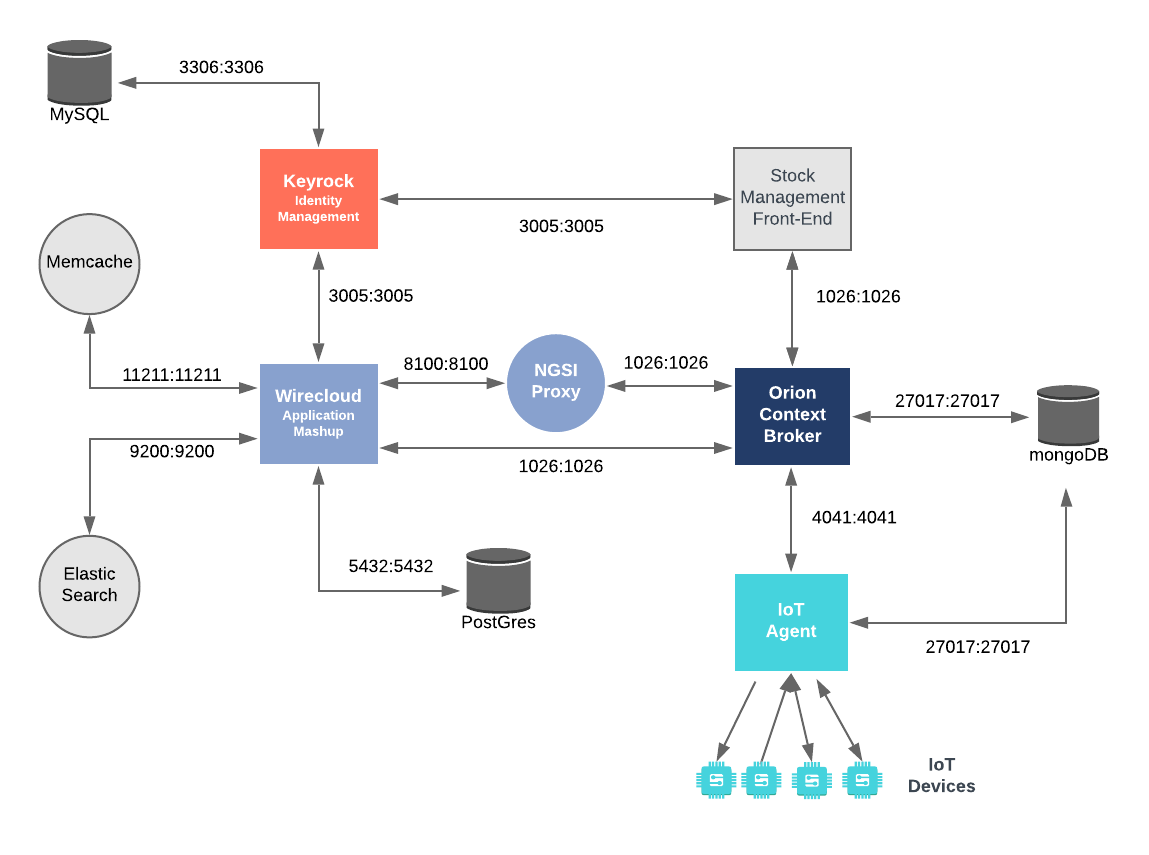
Therefore the overall architecture will consist of the following elements:
- The FIWARE Orion Context Broker which will receive requests using NGSI
- The FIWARE IoT Agent for UltraLight 2.0 which will receive southbound requests using NGSI and convert them to UltraLight 2.0 commands for the devices
- The FIWARE Keyrock Identity Management System
- Used by both the Stock Management System and Wirecloud
- FIWARE Wirecloud an application mashup tool for displaying NGSI entities
-
Three databases
- A PostgreSQL database :
- Used by Wirecloud to hold mashup state
- A MySQL database :
- Used by Keyrock to persist user identities, applications, roles and permissions
- A MongoDB database:
- Used by the Orion Context Broker to hold context data information such as data entities, subscriptions and registrations
- Used by the IoT Agent to hold device information such as device URLs and Keys
- A PostgreSQL database :
-
The Stock Management Frontend does the following:
- Displays store information
- Shows which products can be bought at each store
- Allows users to "buy" products and reduce the stock count.
- A webserver acting as set of dummy IoT devices using the UltraLight 2.0 protocol running over HTTP - access to certain resources is restricted.
- Three additional microservices are used by Wirecloud:
- Memcache, a general-purpose distributed memory caching system.
- ElasticSearch, a full-text search engine
- NGSI Proxy, a server that is capable of redirecting Orion notifications to web pages.
Since all interactions between the services are initiated by HTTP requests, the services can be containerized and run from exposed ports.
The specific architecture of each section of the tutorial is discussed below.
Wirecloud Configuration
image: fiware/wirecloud
        container_name: fiware-wirecloud
        hostname: wirecloud
        ports:
            - "8000:8000"
        networks:
          default:
            ipv4_address: 172.18.1.10

        restart: always
        depends_on:
            - keyrock
            - elasticsearch
            - memcached
            - postgres-db
        environment:
            - DEBUG=True
            - DEFAULT_THEME=wirecloud.defaulttheme
            - DB_HOST=postgres-db
            - DB_PASSWORD=wirepass
            - FORWARDED_ALLOW_IPS=*
            - ELASTICSEARCH2_URL=http://elasticsearch:9200/
            - MEMCACHED_LOCATION=memcached:11211
            - FIWARE_IDM_PUBLIC_URL=http://localhost:3005
            - FIWARE_IDM_SERVER=http://172.18.1.5:3005
            - SOCIAL_AUTH_FIWARE_KEY=wirecloud-dckr-site-0000-00000000000
            - SOCIAL_AUTH_FIWARE_SECRET=wirecloud-docker-000000-clientsecret
        volumes:
            - wirecloud-data:/opt/wirecloud_instance/data
            - wirecloud-static:/var/www/static
The wirecloud container is a web application server listening on a single port:
- Port
8000has been exposed for HTTP traffic so we can display the web page
The wirecloud container is connecting to Keyrock and is driven by environment variables as shown:
| Key | Value | Description |
|---|---|---|
| DEFAULT_THEME | wirecloud.defaulttheme |
Which Wirecloud theme to display |
| DB_HOST | postgres-db |
The name of the Wirecloud database |
| DB_PASSWORD | wirepass |
The password for the Wirecloud database - this should be protected by Docker Secrets |
| FORWARDED_ALLOW_IPS | * |
|
| ELASTICSEARCH2_URL | http://elasticsearch:9200/ |
The location the ElasticSearch service is listening on |
| MEMCACHED_LOCATION | memcached:11211 |
The location the Memcahe service is listening on |
| FIWARE_IDM_PUBLIC_URL | http://localhost:3005 |
The URL of Keyrock used to display the login screen |
| FIWARE_IDM_SERVER | http://172.18.1.5:3005 |
The URL of Keyrock used for OAuth2 Authentication |
| SOCIAL_AUTH_FIWARE_KEY | wirecloud-dckr-site-0000-00000000000 |
The Client ID defined by Keyrock for Wirecloud |
| SOCIAL_AUTH_FIWARE_SECRET | wirecloud-docker-000000-clientsecret |
The Client Secret defined by Keyrock for Wirecloud |
Start Up
To start the installation, do the following:
git clone git@github.com:FIWARE/tutorials.Application-Mashup.git
cd tutorials.Application-Mashup

./services create
Note The initial creation of Docker images can take up to three minutes
Thereafter, all services can be initialized from the command-line by running the services Bash script provided within the repository:
./services start
Then go to your browser and open Wirecloud using the URL: http://localhost:8000/
:information_source: Note: If you want to clean up and start over again you can do so with the following command:
console
./services stop
Log in
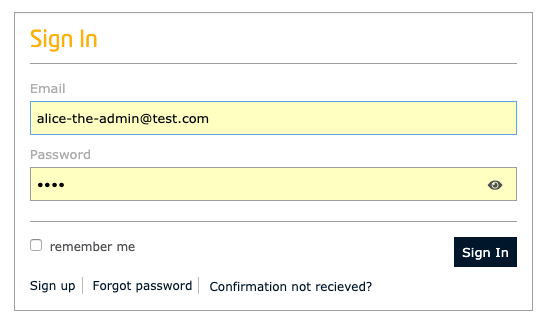
Wirecloud is enabled for Oauth2 security, and as mentioned previously, user an admin user has already been created
for the Wirecloud application. To start creating a mashup, click on the Sign in button on the top right of the
page and sign in to Keyrock using alice-the-admin@test.com with the password test.
Note: if you want to see how Alice has been authorized to use Wirecloud, you can Log in to Keyrock itself, and look at Alice's applications (
http://localhost:3005/idm/applications)The Wirecloud application is set up as follows:
- URL:
http://localhost:8000- Callback:
http://localhost:8000/complete/fiware/- The application has one single role called
admin- The
adminrole has a single blank permission.- The
adminrole has been assigned to Alice.
Adding Resources to Wirecloud
As noted above, Wirecloud relies on widgets and operators to connect to NGSI sources, manipulate data and display
something on screen. As a first step these widgets (*.wgt) must be uploaded into Wirecloud. It is possible to do
this programmatically, but for this tutorial, the user is directed to upload widgets manually.
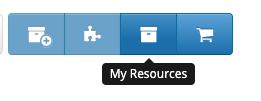
Upload Widgets
To upload resources click on the My Resources button:
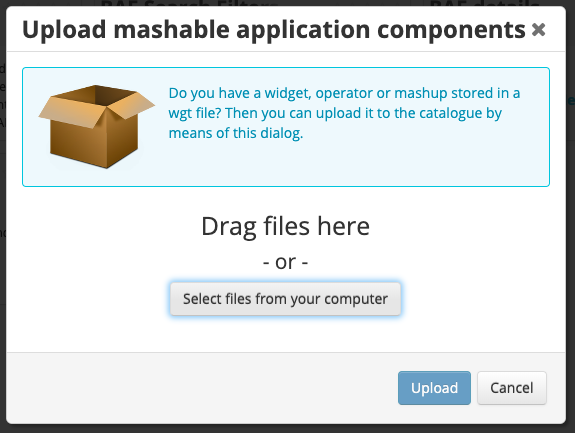
A series of resources may already be available, however for this tutorial additional widgets and operators are required. Click on the Upload button
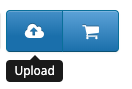
Then and click on Select files from your computer.
Sources of Wirecloud Widgets can be found on the
Wirecloud Marketplace. Alternatively
individual Widget binaries (*.wgt) can be downloaded directly from available releases on GitHub. A list of common
widgets and their location can be found in the appendix to the
Wirecloud documentation
Navigate to the root of this repository and select all the files found in the widgets directory as shown:
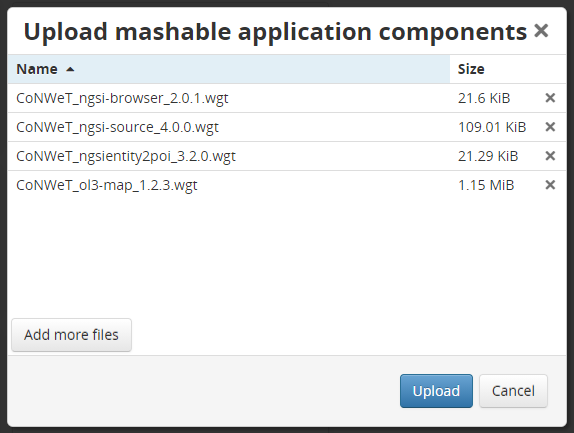
Clicking on upload will add the resources to Wirecloud.
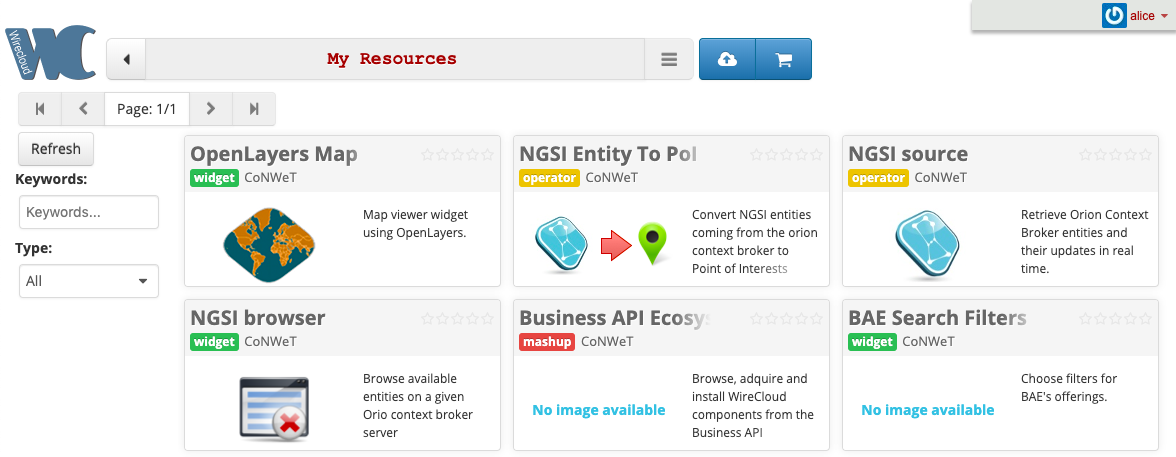
Just click on any available widget to obtain a summary of the widget's usage. More details about the available inputs and outputs and how to wire up each widget can do can be found in the widget's documentation.
To return to the homepage, click on the back button:

Creating a Workspace
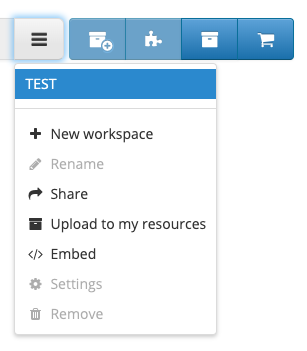
Individual mashups are created in different workspaces, allowing the user to offer separate views with different URLs. To create a workspace click on the hamburger button and select new workspace.
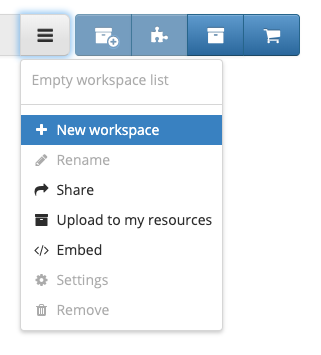
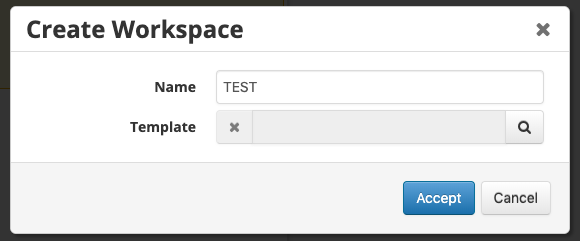
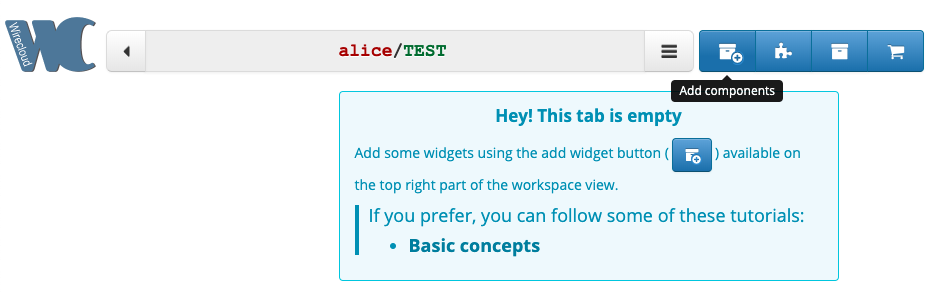
Fill in the dialog as shown to create an empty workspace.
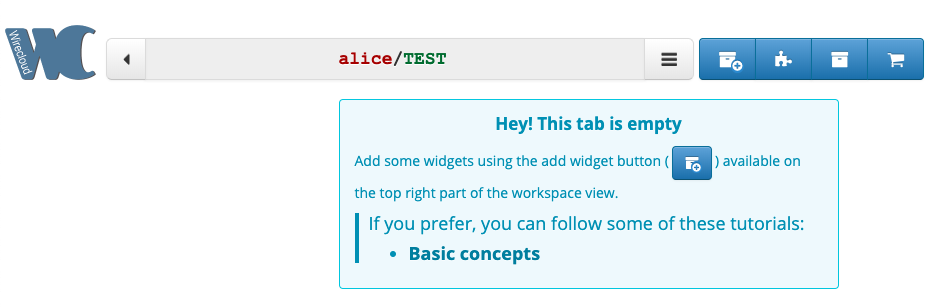
The workspace will open. The URL in the browser bar will alter to http://localhost:8000/<user>/<workspace>.
The workspace will also be added to the list of available workspaces found under the hamburger button. Any available workspace can be selected on click
You can return to the homepage by selecting the back button
Creating Application Mashups
An application mashup can be created by adding widgets to a workspace. At a minimum there must be one data source and one visual component, but some widgets combine these functions into a single browser widget.
More complex mashups will consist of a series of widgets and operations linked together using wirecloud wiring.
Creating a simple Mashup
The Hello World of Wirecloud components involves adding a single browser widget on screen and then configuring it to display some context data.
As you would expect, this tutorial relies on context data from the context broeker. To ensure that the IoT devices are
running, open the tutorial application (http://localhost:3000/) in a new browser window. Log in as
bob-the-manager@test.com with the password test and click on device monitor. Bob can switch on the lamp to obtain
some context data for the mashup.
Selecting Widgets and Operators
Click the Edit button to switch the workspace to edit mode, then click on the Find Components button to add a widget or operator to the workspace
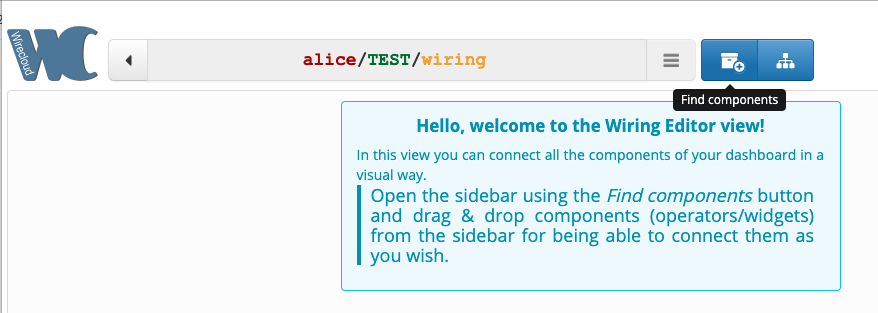
The components sidebar will be displayed
NGSI Browser Widget
Since we require a visual component, in the components sidebar select Widgets and then scroll down until you find the NGSI Browser
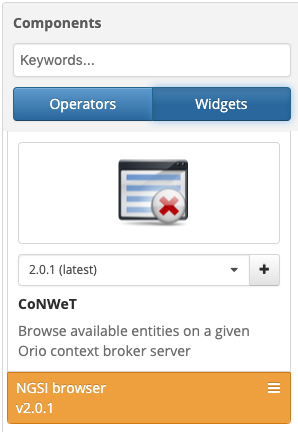
Clicking on the + button will add an unconfigured NGSI Browser on screen
Note: the widget can be removed by clicking on the x at the top right of the window
The next step is to configure the widget. Click on the wiring button to switch to the wiring view, and select Widgets from the components sidebar. Scrolling down to the NGSI browser shows an available widget in orange
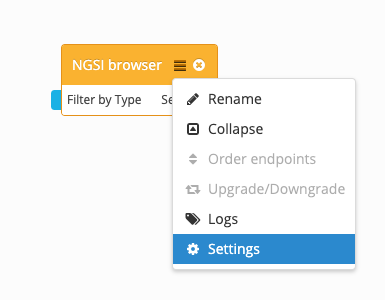
Clicking on the orange button brings up the settings to configure. Select the hamburger to obtain a dropdown and click on settings to configure as shown:
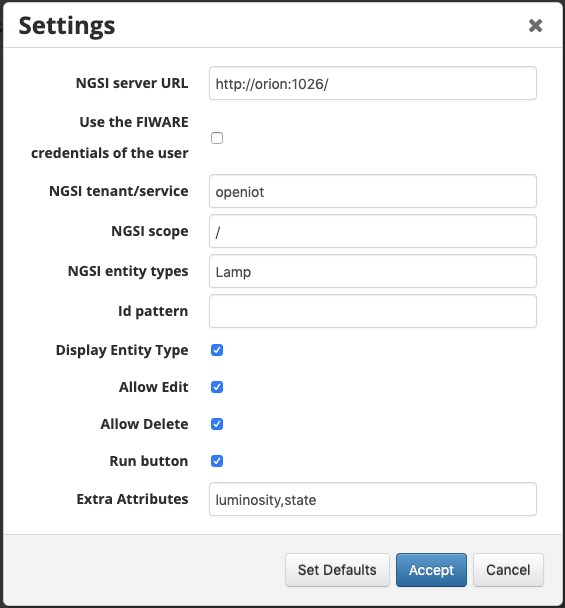
Then click on Accept
Click on the back button to return to the workspace view:
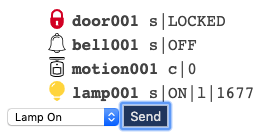
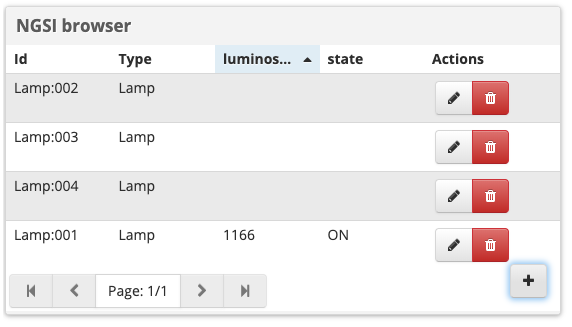
The NGSI browser should be displaying live data as shown:
Combining Multiple Widgets within a Mashup
The simple widget in the example above give above combines both input and output into a single component, but it is when a series of operators and widgets are combined that the true power of Wirecloud can be seen. Simple data flows can be mapped graphically on screen and a mashup can be created by a user with minimal understanding of the technologies used to create the mashup.
Selecting Widgets and Operators
From the workspace page, click on edit and then click on the jigsaw button to bring up the wiring editor view.
Then click on add components to bring up the components sidebar. We will require a combination of both Operators and Widgets
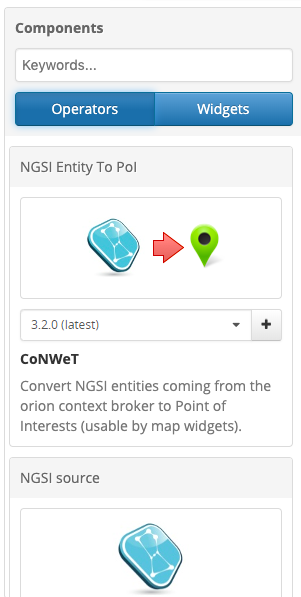
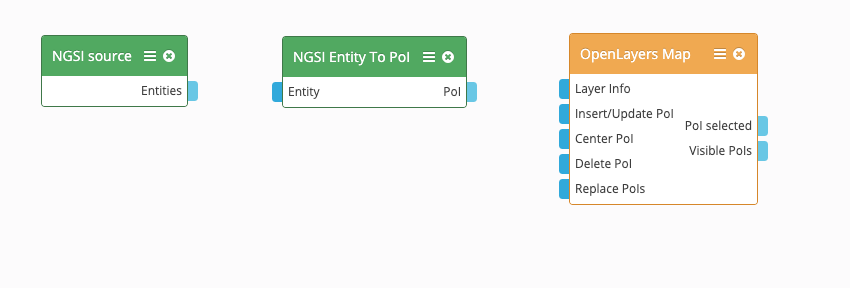
Click on the operators tab, and select an instance of NGSI Source and an instance of NGSI-Entity-to-POI by pressing the + button. A green bar will appear below each entry which can be dragged-and-dropped onto the wiring editor view.
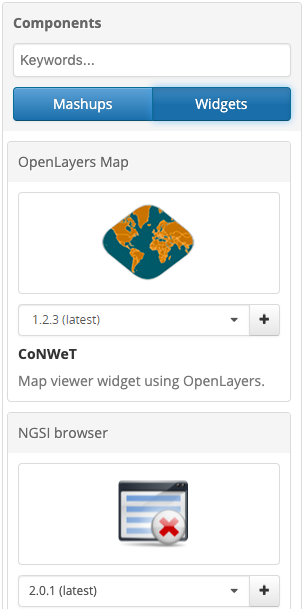
Then click on the Widgets tab and add an instance of the Open Layers Map Widget and drag it onto the wiring editor view.
| Operators | Widgets |
|---|---|
 |
 |
The result is a series of unconnected components on screen.
Hovering over the connectors will give more information about the available inputs and outputs. Click and drag to connect the elements as shown.
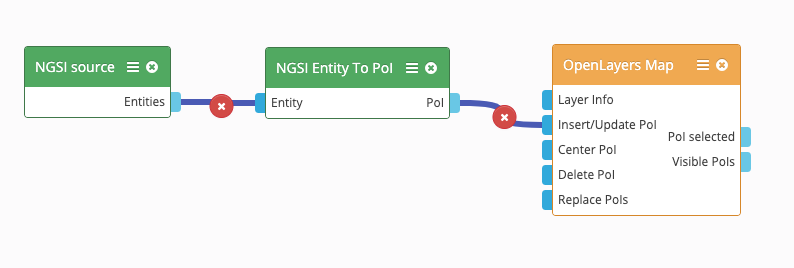
You can see that flow of data can be visualized on screen, in the mashup we wish to display Points of Interest (POIs) on screen. In order to do this we will receive data entities from an NGSI source, the data from each entity will be converted into a POI. Finally each POI will be inserted onto the OpenLayers Map.
NGSI Source Operator
The NGSI Source operator allows you to connect to an Orion Context Broker and use it as source of data. This is accomplished by creating a subscription to obtain real time notifications about changes on the entities of interest. It is an example of a data source component.
Full details of the operator documentation can be found within the running application under the My Resources
screen:
http://localhost:8000/wirecloud/home#view=myresources&subview=details&resource=CoNWeT%2Fngsi-source%2F4.0.0&tab=Documentation
To configure the component, click on the NGSI Source hamburger button and select settings:
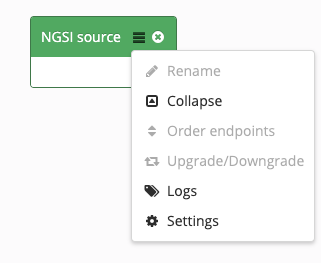
Amend the settings as shown below and click accept.
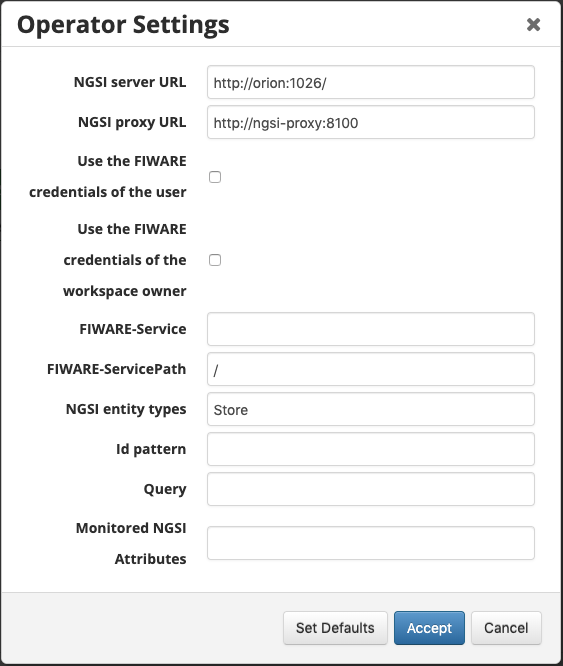
- The NGSI server needs to be the location of the Orion Context broker
- The NGSI proxy is used to bypass CORS issues when accessing webservices using JavaScript. This is a simple endpoint which ensures that the Orion Context Broker is only accessed via a server-side API call.
- User credentials and workspace credentials should be left unchecked
- The FIWARE service and service path match the data found within the Orion Context Broker
- ID pattern, Query and Monitored Attributes can be left blank.
NGSI Entity to POI Operator
The NGSI Entity to POI operator transforms NGSI entities to Points of Interest. It is an example of a data manipulation component. To be able to do so, those entities should contain an attribute containing the coordinates of the entity. Also, take into account the fact this operator is generic, so marker bubbles of the PoIs created by this operator will be a mere composition of the attribute/value pairs.
Full details of the operator documentation can be found within the running application under the My Resources
screen:
http://localhost:8000/wirecloud/home#view=myresources&subview=details&resource=CoNWeT%2Fngsientity2poi%2F3.1.2&tab=Documentation
To configure the component, click on the NGSI Entity to POI hamburger button and select settings:
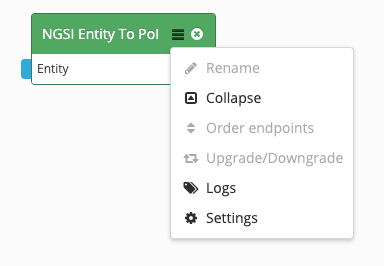
Amend the coordinates setting as shown below and click accept.
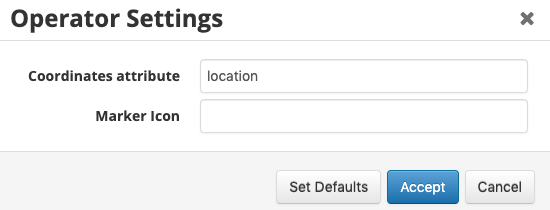
According to the FIWARE Data Models
Guidelines an attribute
called location should be used for geographical coordinates. Coordinates should be encoded using GeoJSON. Since this
convention has been used for the tutorial data, the widget knows how to extract a location from the Store entity.
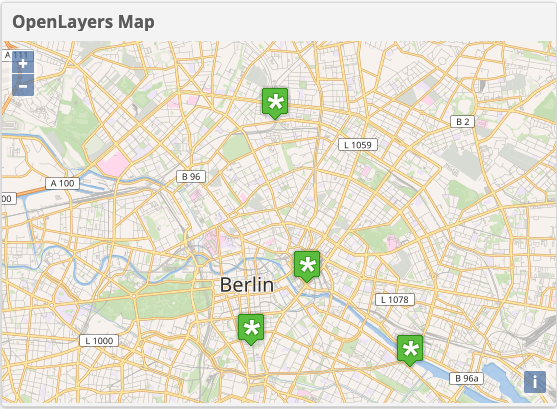
Open Layers Map Widget
The Open Layers Map Widget allows a user to display geographic data onto an Open Layers map. It is an example of a visual component. Open Layers is a free, open-source JavaScript library, released under the 2-clause BSD License
Full details of the widget documentation can be found within the running application under the My Resources screen:
http://localhost:8000/wirecloud/home#view=myresources&subview=details&resource=CoNWeT%2Fol3-map%2F1.1.2&tab=Documentation
To configure the component, click on the Open Layers Map hamburger button and select settings:
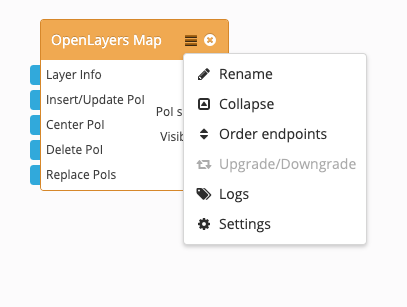
Amend the settings as shown below and click accept.
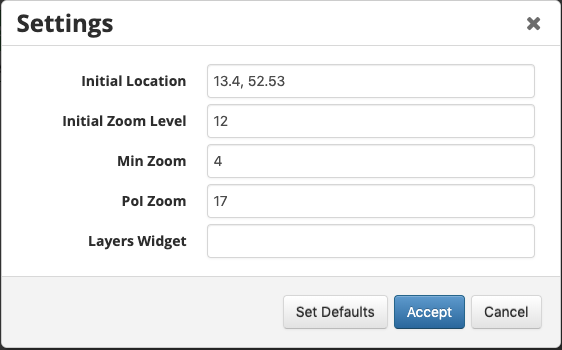
The Store Data is found in Berlin. This city is located at 52.53N 13.4E. The initial location setting is defined in Long/Lat format. The other settings help to display the map over the right part of the globe.
The updated mashup can be seen on the workspace tab (refresh the browser if necessary).
http://localhost:8000/alice/test#view=workspace&tab=tab
Clicking on the POIs retrieves additional data from each stores.
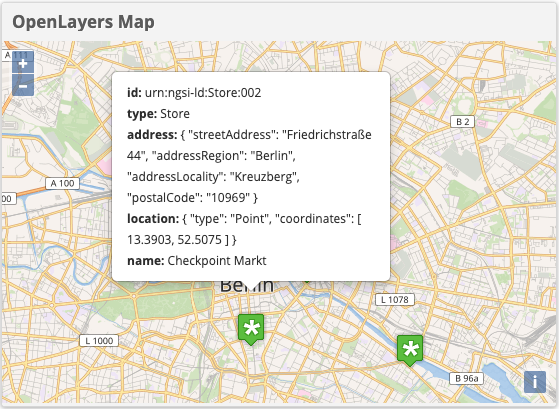
Currently the data is displayed as unformatted JSON. This is because the Store context data entities with the tutorial
example are not using a standard FIWARE data model. If a standard data model such as
Building had been used the
data would be formatted in an appropriate manner and a Building specific icon would be used.